Question 47 CEL02 - Chief Engineer - Limited (Alt)
As shown in figure "A" of the illustration, what is true concerning the illustrated frequency response curve? Illustration EL-0076
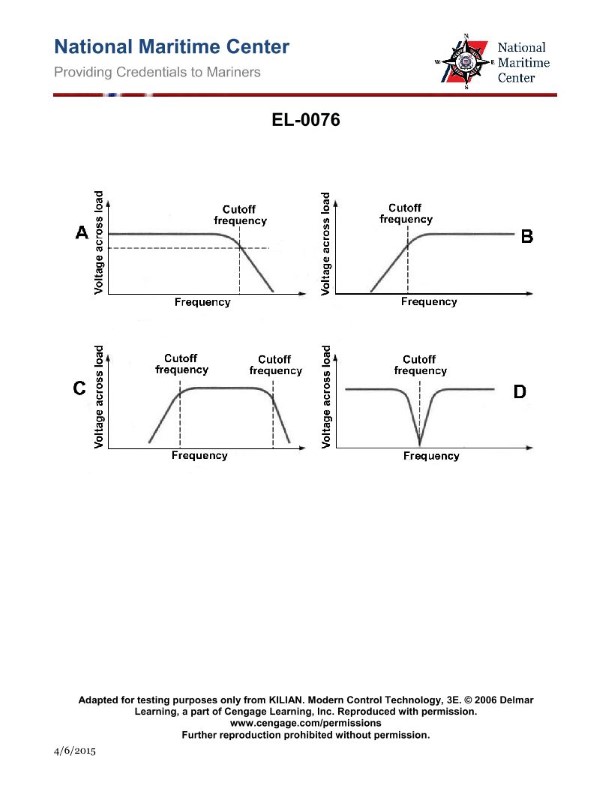
The Correct Answer is B **Explanation for Option B (Correct Answer):** Option B states that "Low frequencies below the cutoff-frequency are passed and high frequencies above the cutoff-frequency are attenuated." This description defines the characteristic operation of a **Low-Pass Filter (LPF)**. When viewing a frequency response curve (like the implied Figure A), the horizontal axis represents frequency, and the vertical axis represents gain (or amplitude). In a Low-Pass filter curve, the response is relatively flat and high (indicating the frequencies are "passed" or transmitted with minimal loss) until the curve reaches the cutoff frequency ($f_c$). After $f_c$, the gain rapidly decreases (indicating the frequencies are "attenuated" or filtered out). Since the illustrated curve shows high transmission for low frequencies and rapid attenuation for high frequencies, it is a Low-Pass response, making option B the correct statement. **Explanation for Incorrect Options:** * **A) Low frequencies below the cutoff-frequency are attenuated and high frequencies above the cutoff- frequency are passed.** * This describes a **High-Pass Filter (HPF)**, where the gain is low at low frequencies and high at high frequencies. This is the opposite of the response shown in the implied figure A (Low-Pass). * **C) Low frequencies below the cutoff-frequency are passed and high frequencies above the cutoff-frequency are passed.** * This describes an ideal **All-Pass Filter** or a device with a very flat frequency response across the entire spectrum, showing no significant attenuation. This contradicts the curve, which clearly illustrates a region of transition and attenuation (the cutoff). * **D) Low frequencies below the cutoff-frequency are attenuated and high frequencies above the cutoff- frequency are attenuated.** * This describes a **Band-Stop Filter (or Notch Filter)**, where only a narrow range of middle frequencies is passed, or it describes a filter that attenuates all tested frequencies. This does not match the frequency response curve of a Low-Pass filter.
Pass Your Coast Guard Licensing Exams!
Study offline, track your progress, and simulate real exams with the Coast Guard Exams app