Question 205Electricity & Electronics - 1st Asst/Chief
70% to passAs shown in figure "A" of the illustration, what is true concerning the illustrated frequency response curve? Illustration EL-0076
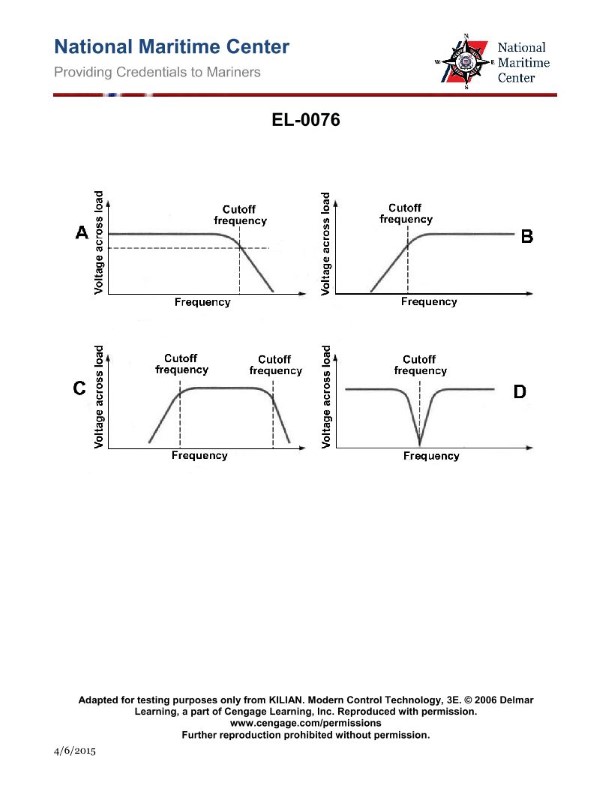
The correct answer is D) Low frequencies below the cutoff-frequency are attenuated and high frequencies above the cutoff-frequency are passed. This is correct because the illustrated frequency response curve depicts a high-pass filter, where low frequencies below the cutoff-frequency are attenuated, while high frequencies above the cutoff-frequency are passed through. This type of filter is commonly used to remove unwanted low-frequency signals, such as hum or rumble, while preserving the desired high-frequency content. The other options are incorrect because they do not accurately describe the behavior of a high-pass filter. Option A describes a band-pass filter, option B describes a low-pass filter, and option C describes a flat, non-filtering response, which is not the case for the illustrated frequency response curve.
Ready to test your knowledge?
Take a Electricity & Electronics - 1st Asst/Chief Practice ExamPass Your Coast Guard Licensing Exams!
Study offline, track your progress, and simulate real exams with the Coast Guard Exams app