Question 530Electricity & Electronics - Assistant Engineer
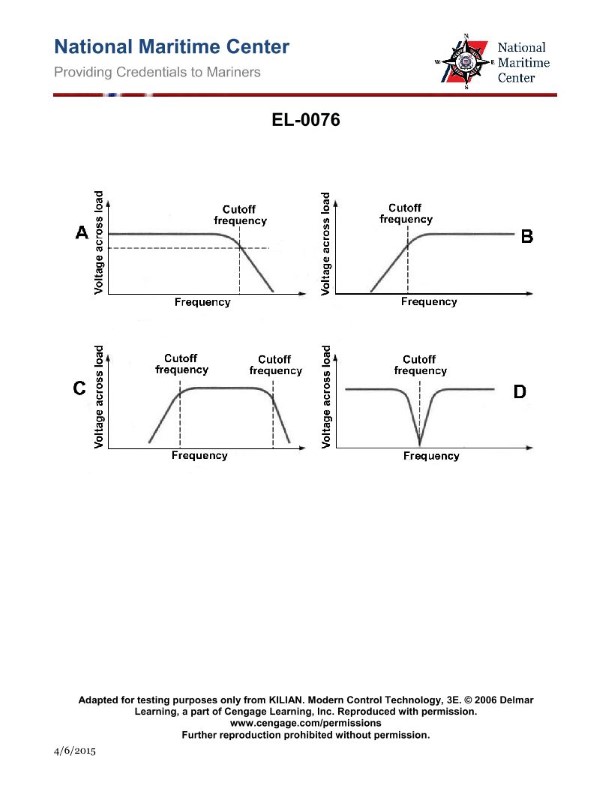
70% to passIn referring to the graphs shown in the illustration, which of the following figures represents a bandpass filter? Illustration EL-0076
AA
BB
CC
DD
AI Explanation
The correct answer is C. The graph labeled C in the illustration represents a bandpass filter. A bandpass filter is a type of filter that allows signals within a certain frequency range to pass through while attenuating signals outside that range. This is the defining characteristic of a bandpass filter, and the graph in option C clearly shows this frequency-selective behavior. The other options do not depict a bandpass filter. Option A shows a lowpass filter, Option B shows a highpass filter, and Option D shows a notch filter, which is a different type of frequency-selective filter.
Related Questions
Q255:In order to properly set up programmable motor protection, it is necessary to kn...
Q352:As shown in figure "6" of the illustration, what does the symbol represent as us...
Q107:Rotor-to-stator air gap readings should be periodically taken for electrical gen...
Q426:Suppose a cargo vessel of 1600 gross tons or more is fitted with emergency stora...
Q476:Refer to the diagram of the AC turbo-electric drive system as shown in the illu...
Ready to test your knowledge?
Take a Electricity & Electronics - Assistant Engineer Practice ExamOfficial Resources
Pass Your Coast Guard Licensing Exams!
Study offline, track your progress, and simulate real exams with the Coast Guard Exams app