Question 19 QMED02 - Electrician-Refrigerating Engineer
In which figure shown in the illustration will the highest voltage be induced? Illustration EL-0028
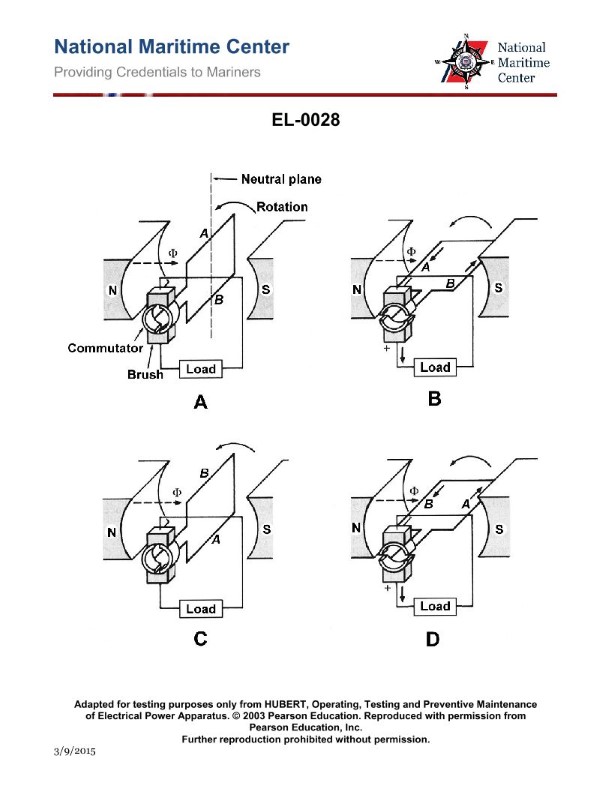
The Correct Answer is D. ### 2. Explanation of why option D ("both figures "B" and "D"") is correct The voltage (electromotive force, or EMF) induced in a conductor moving through a magnetic field is determined by Faraday’s Law of Induction. This law states that the induced voltage is directly proportional to the rate of change of magnetic flux ($\frac{d\Phi_B}{dt}$). For a conductor moving in a field, the induced voltage ($E$) is maximized when the conductor: 1. Moves at the highest velocity ($v$). 2. Cuts the magnetic field lines perpendicularly (at $90^{\circ}$). 3. Moves through the strongest possible magnetic field ($B$). Figures B and D must represent the conditions under which the rate of flux cutting is maximized—for instance, if B and D show the conductors moving faster than A and C, or if B and D show the conductors moving perfectly perpendicular to the flux lines while A and C show parallel or slow movement. Since the induced voltage depends on the maximum *rate* of cutting the magnetic lines, both figures B and D must illustrate the scenarios yielding the maximum rate, resulting in the highest induced voltage. ### 3. Explanation of why the other options are incorrect **A) figure "A" only is incorrect:** Figure A must represent a scenario where the rate of flux change is low compared to figures B and D. This could be due to slower movement, movement parallel to the magnetic field lines (which induces zero voltage), or movement through a weaker magnetic field. Therefore, A alone does not represent the highest induced voltage. **B) figure "B" only is incorrect:** While figure B is one of the scenarios leading to the highest induced voltage, this option is incomplete because figure D also represents a scenario where the maximum voltage is induced. To provide the complete answer showing all figures with maximum induced voltage, D must also be included. **C) both figures "A" and "C" is incorrect:** As noted above, figures A and C represent scenarios where the induced voltage is low (low rate of flux change). This option incorrectly pairs two low-voltage conditions.
Pass Your Coast Guard Licensing Exams!
Study offline, track your progress, and simulate real exams with the Coast Guard Exams app